

Performance insights
that prove what works
and drive better results.
Telvanta.ai gives you real-time visibility into every win-back campaign and journey—so you can measure impact, optimize continuously and bring more customers back.
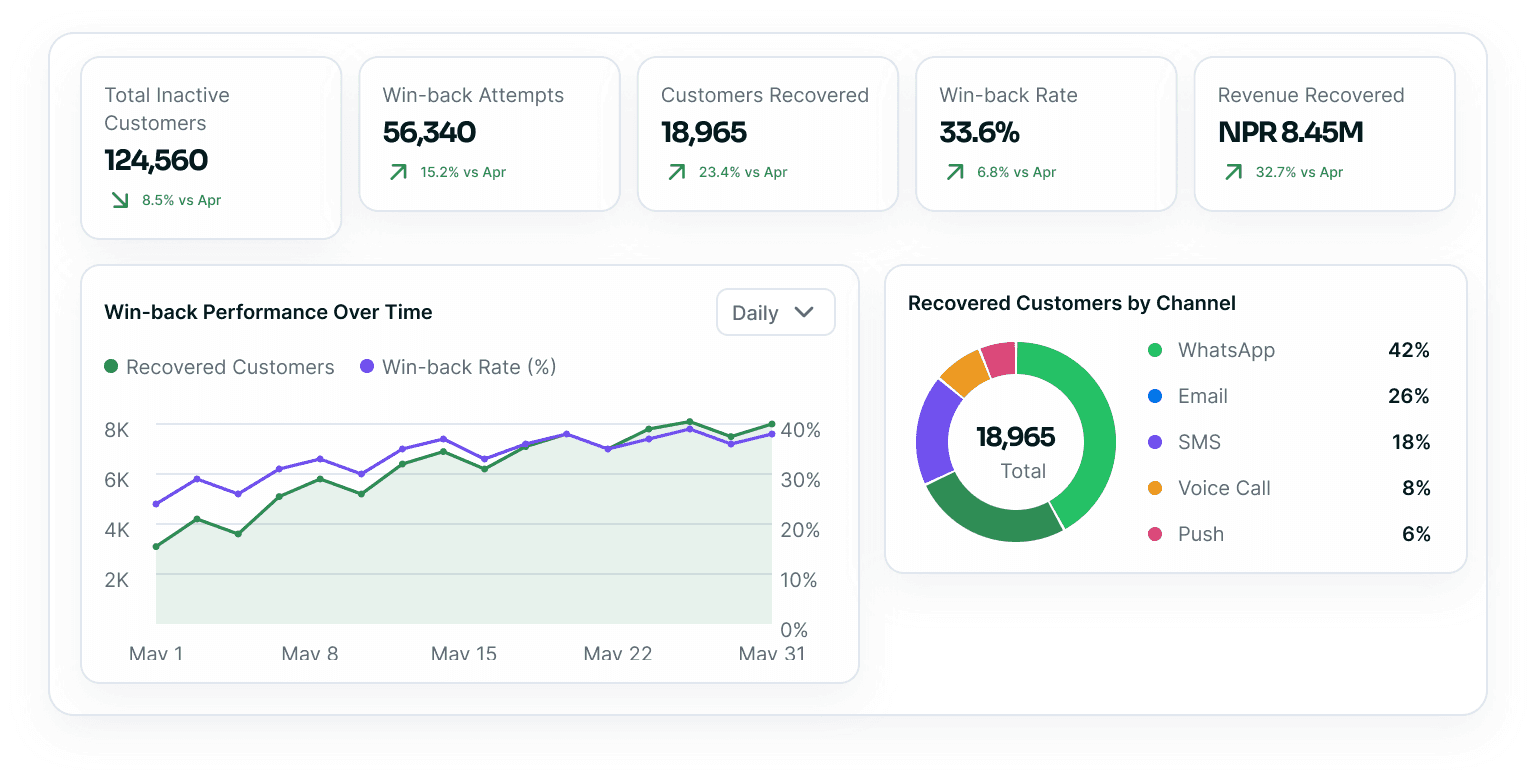
Why performance insights matter
Trusted by growing businesses
The performance insights from Telvanta.ai helped us recover 31% of inactive customers and increase repeat purchases by 35% within 60 days.
 Priya JoshiGrowth Manager,Daraz Nepal
Key insights at a glance
| Campaign Name | Sent | Recovered | Win-back Rate | Revenue Recovered |
|---|---|---|---|---|
| May Mega Offer | 12,450 | 4,521 | 36.3% | NPR 2.15M |
| We Miss You – 20% Off | 10,230 | 3,214 | 31.4% | NPR 1.48M |
| Free Shipping Weekend | 8,540 | 2,630 | 30.8% | NPR 1.12M |
| VIP Comeback Offer | 6,230 | 2,010 | 32.2% | NPR 1.07M |
| Re-engage Series – Email | 18,890 | 6,590 | 34.9% | NPR 2.63M |
| Journey | Recovered | Win-back Rate |
|---|---|---|
| Lapsed Customer Journey | 7,845 | 41.8% |
| Subscription Expired Journey | 5,120 | 35.2% |
| Low Engagement Journey | 3,210 | 28.6% |
| Abandoned Cart Journey | 1,890 | 26.4% |
| Long-term Inactive Journey | 900 | 22.1% |
How performance insights drive better results
1. Track & Measure
Collect real-time data from every campaign, channel and touchpoint.

2. Analyze & Discover
Identify what’s working, what’s not and why.
3. Get Actionable Insights
AI-powered recommendations to improve performance.
4. Optimize & Refine
Adjust offers, timing, channels and journeys for better results.
5. Grow & Retain
Recover more customers and build lasting relationships.
Deeper analytics for every decision
Powerful reporting for every team
Real-time Dashboards
Live metrics and alerts to track performance instantly.
Custom Reports
Build and schedule custom reports for any timeframe.
Export & Share
Export data and share insights with your team in one click.
Drill-down Analytics
Dive deep into segments, channels and customer data.
Benchmarking
Compare performance across campaigns and time periods.
AI Recommendations
Get smart suggestions to maximize win-back success.
See what’s working. Do more of it.
Use performance insights to run smarter win-back campaigns and recover more customers.